Buildings consume a large share of the world's electricity and HVAC output. Zero-energy buildings aim to produce as much renewable energy as they consume annually, but evaluating whether a structure can reach that target requires rigorous environmental simulation. I worked in a small undergraduate team, led by Viraj Voditel (now CEO of Techture), to digitally model the BITS Pilani library and assess its renewable energy potential using solar studies, wind analysis, and LEED standards.
What is a zero energy building
A zero-energy building (ZEB) is a structure where the total annual energy consumption is roughly equal to the renewable energy generated on site. The building still draws from the grid, but over a full year, it puts back as much as it takes. The result is a net-zero carbon footprint for building operations.
Government mandates for ZEBs are expanding globally, and the principles are becoming increasingly relevant in countries like India where energy demand from buildings is growing fast. This project explored whether those principles could be applied to an existing institutional structure that was never designed with sustainability in mind.
Solar tracking study
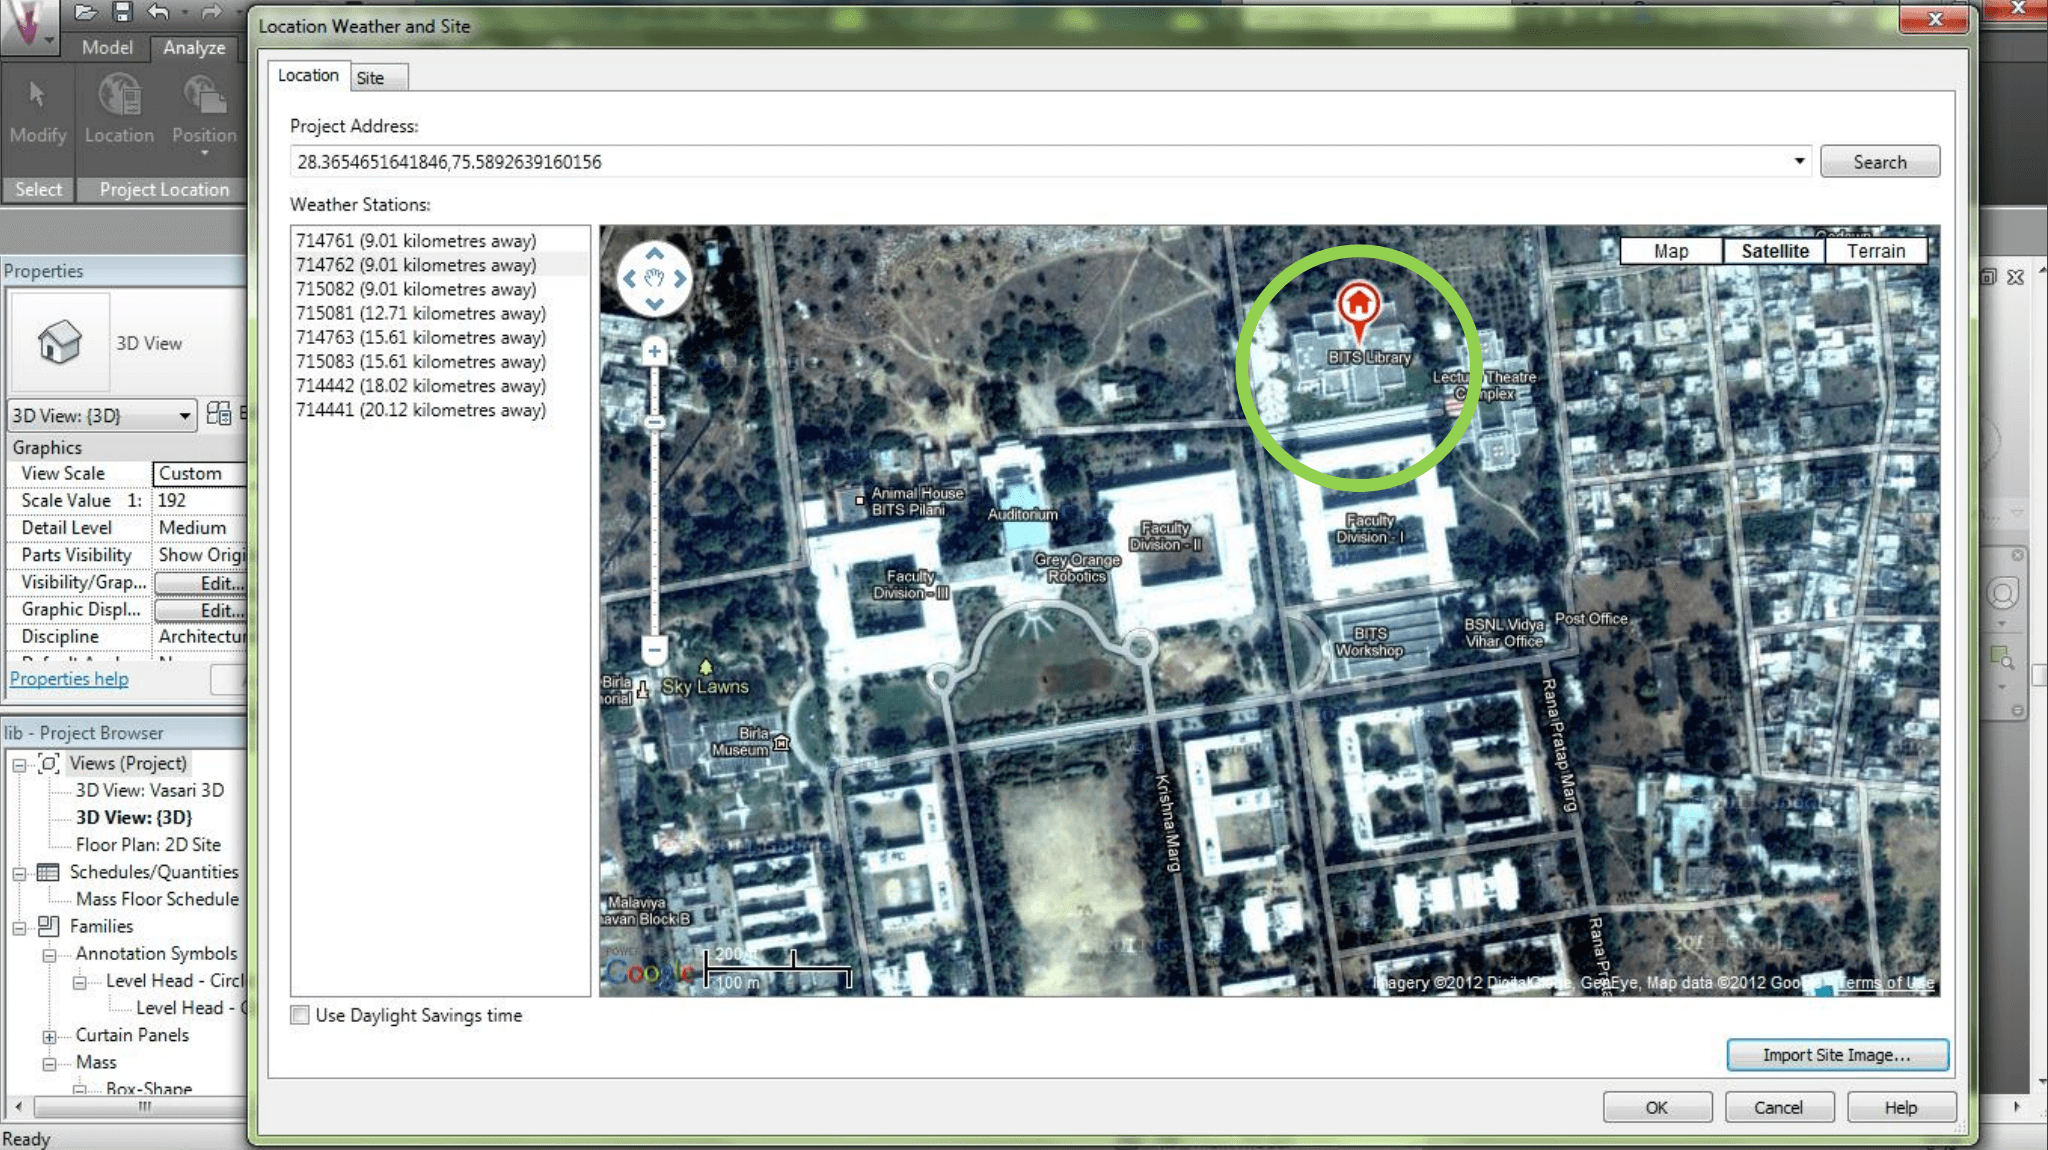
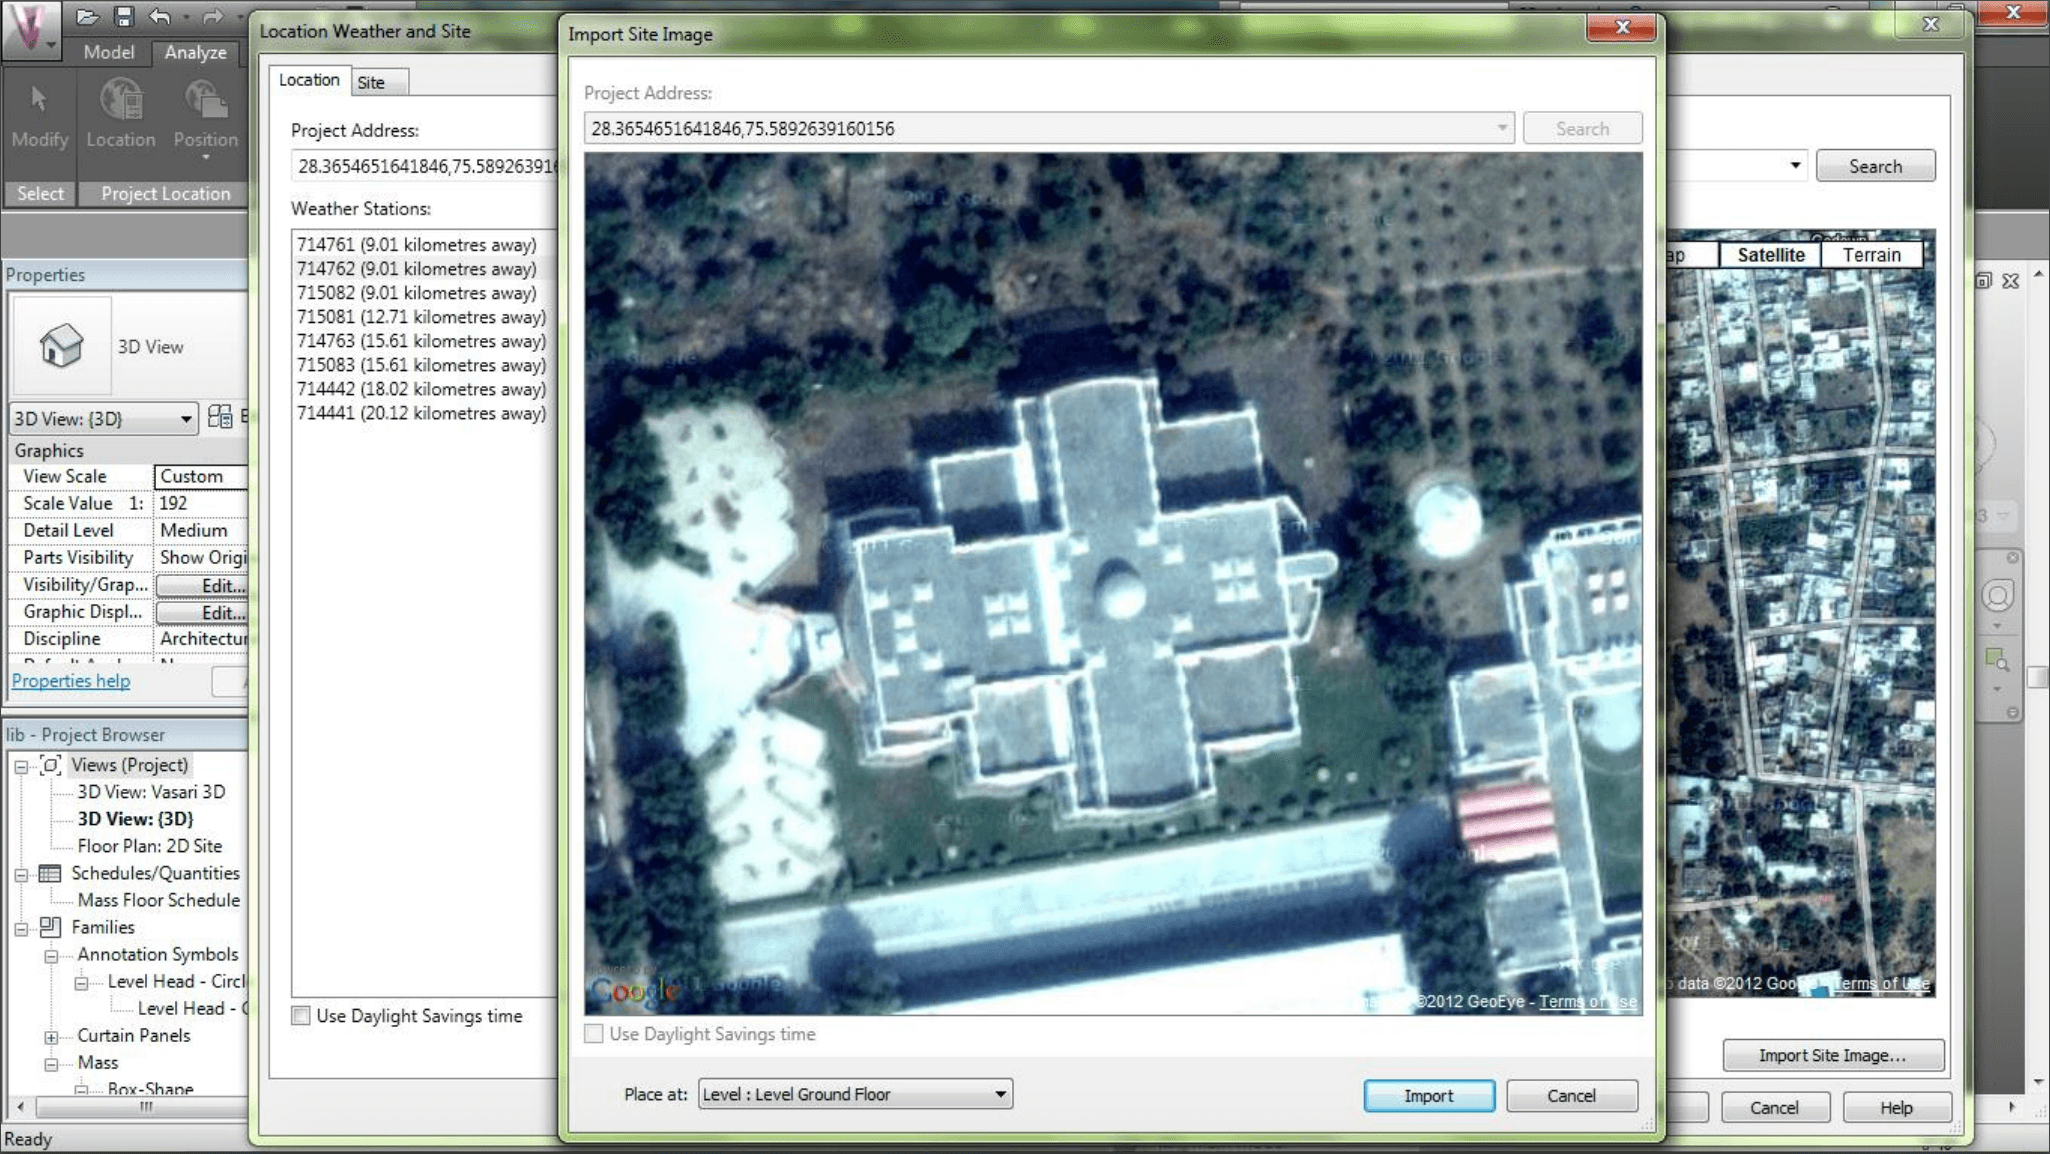
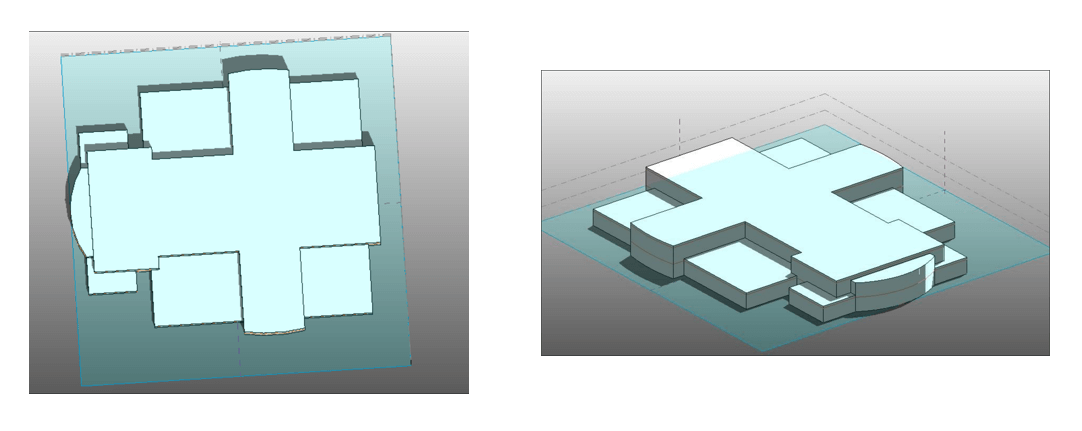
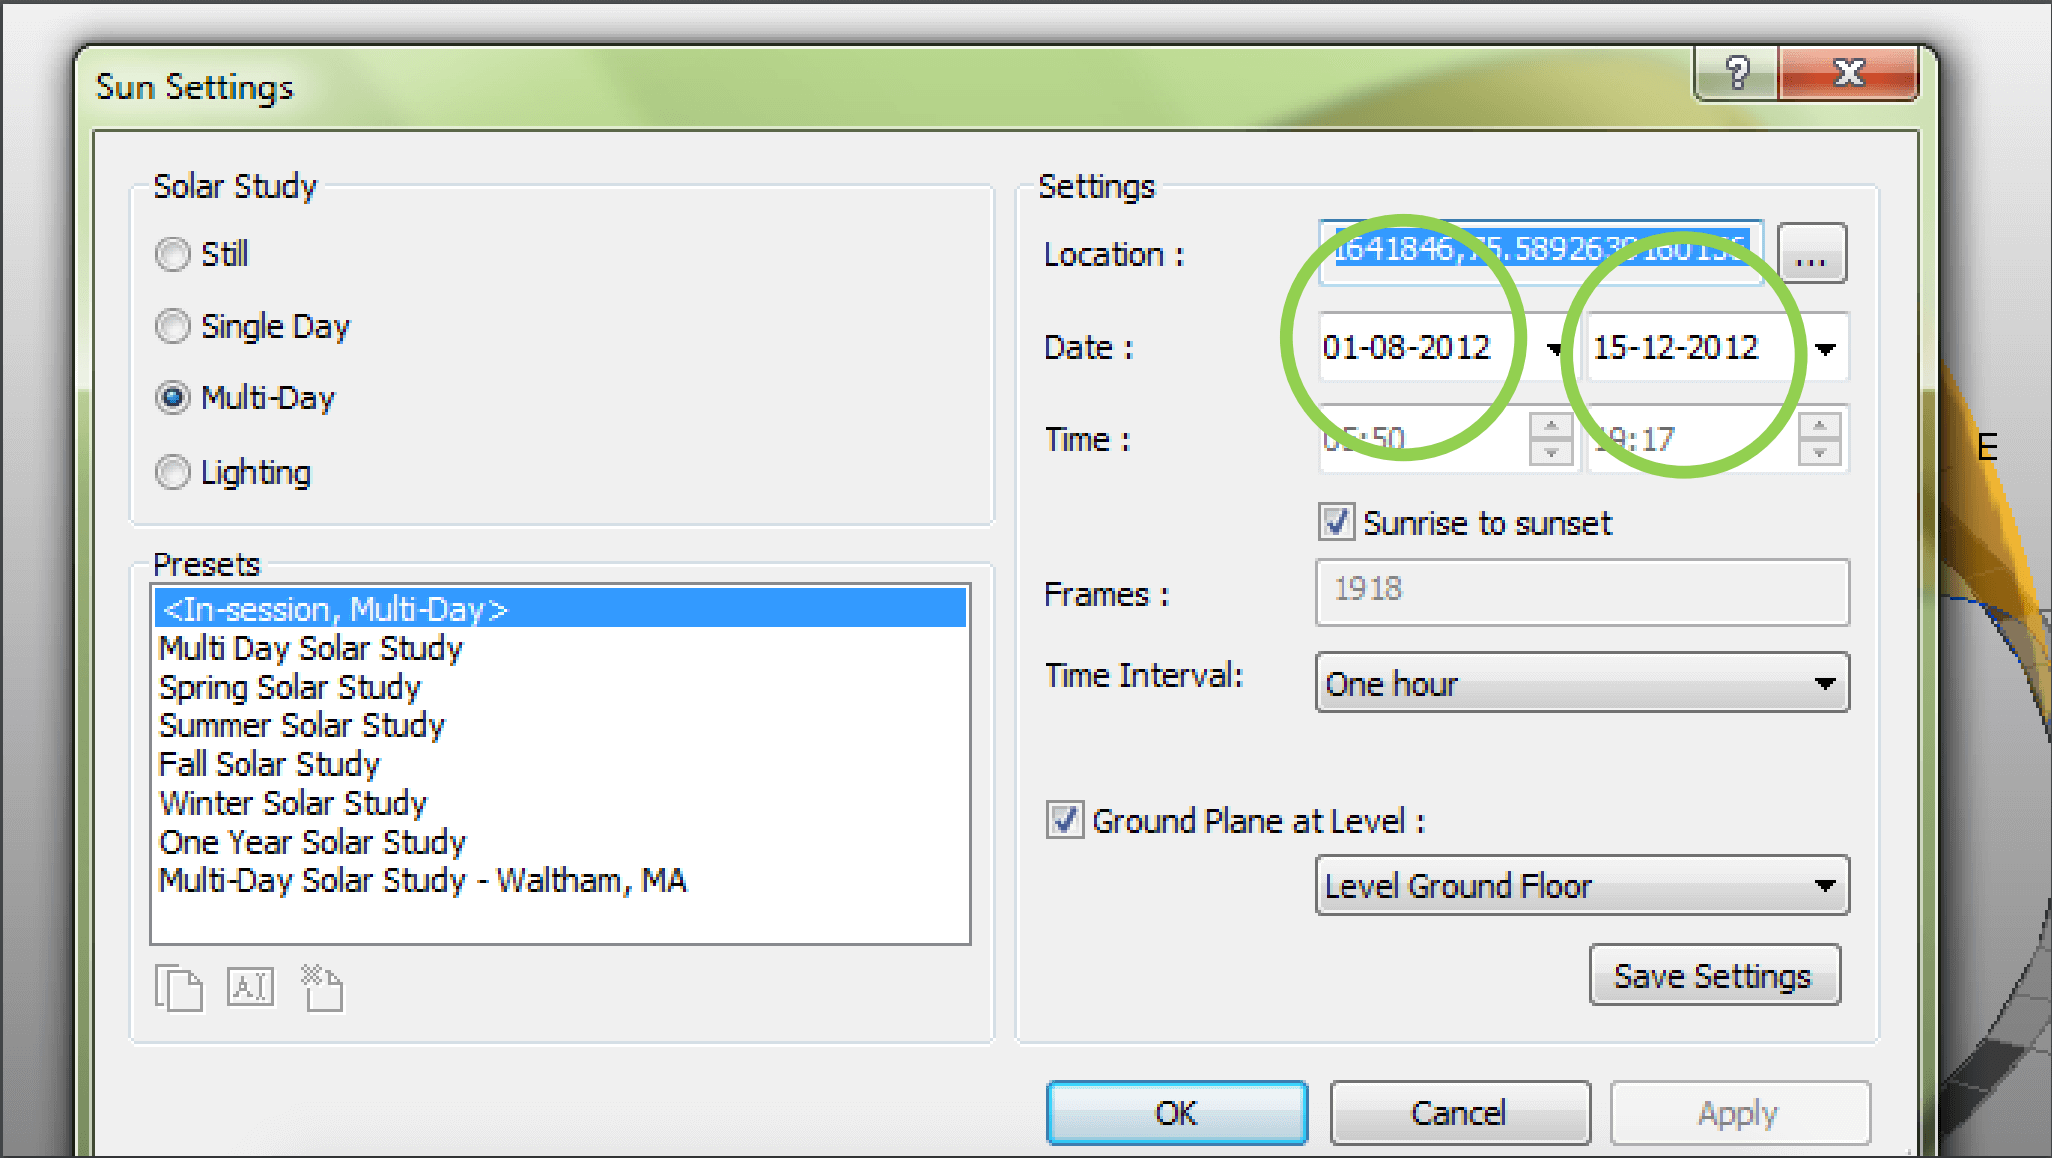
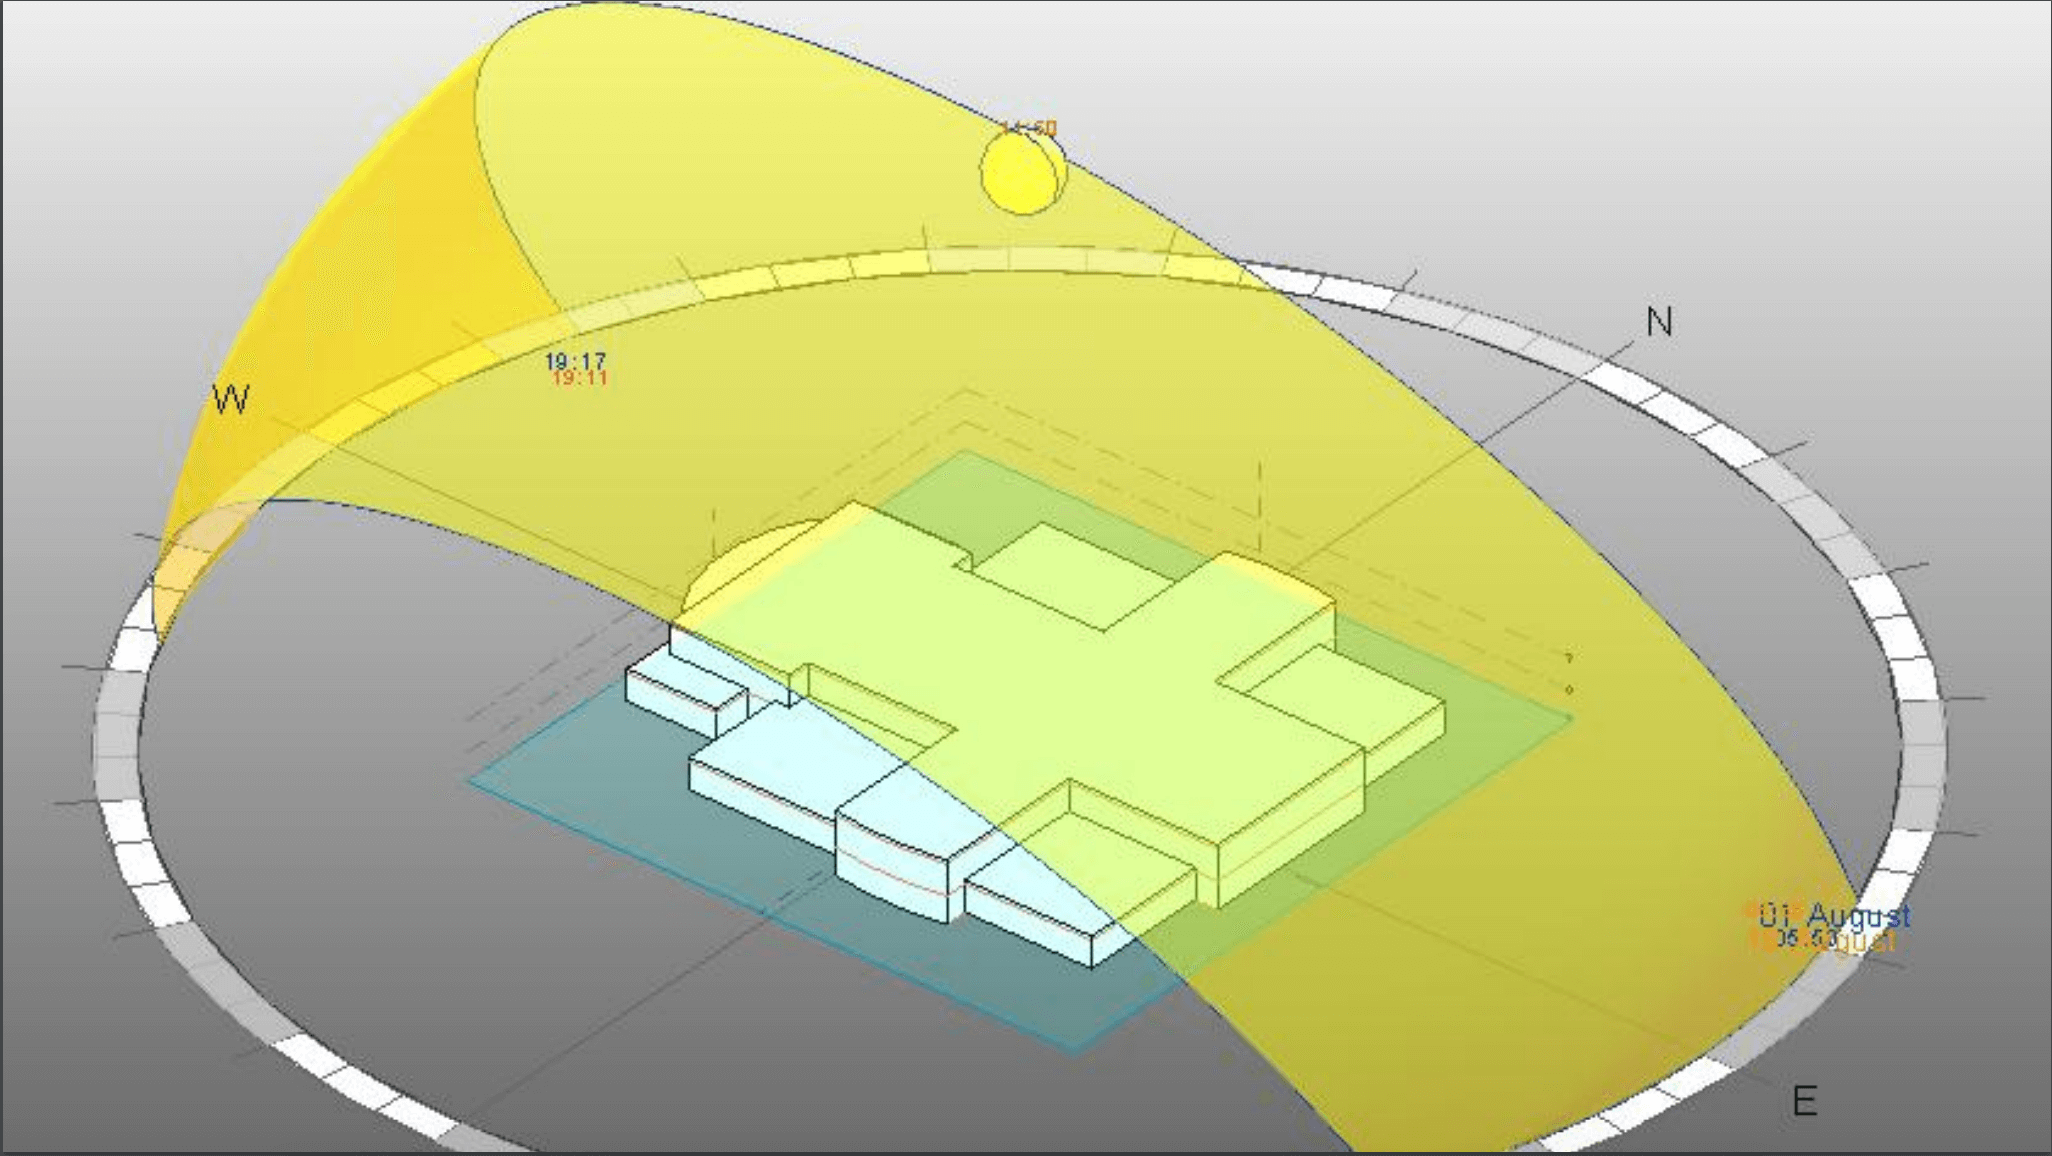
The first step was building a digital model of the BITS Pilani library inside Autodesk Vasari, using satellite imagery as a reference. With the model in place, we ran a multi-day solar tracking study from August through December 2012 to understand how sunlight interacts with the building throughout the day and across seasons.
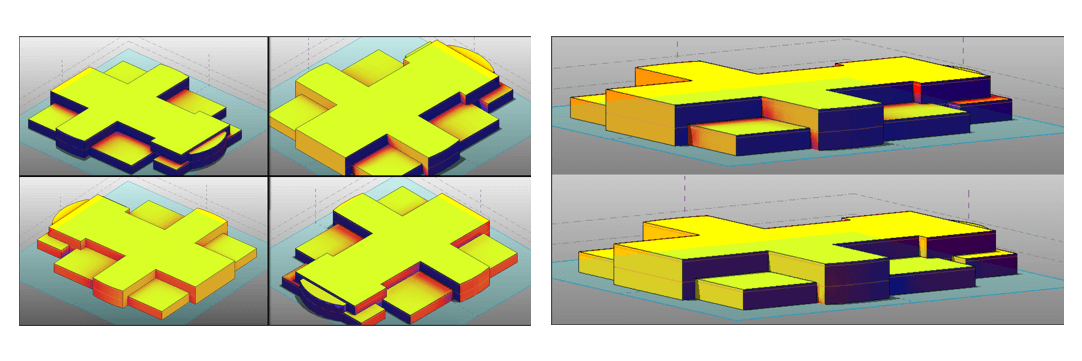
The final incident solar radiation analysis mapped how much energy each surface of the building receives at different times. Blue zones receive relatively less sunlight, yellow zones receive moderate amounts, and red zones are overheated. This data directly informs decisions about building orientation, massing, and where to place solar panels.
Wind analysis
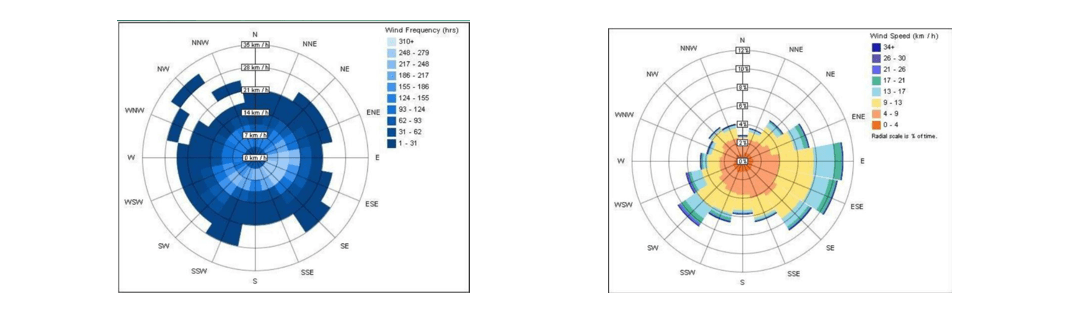
A wind-rose diagram maps wind speed, direction, and frequency over a given time period. The chart uses 16 angular wedges, each representing 22.5 degrees. The radius of each wedge shows how often wind came from that direction. Color segments within each wedge indicate speed ranges.
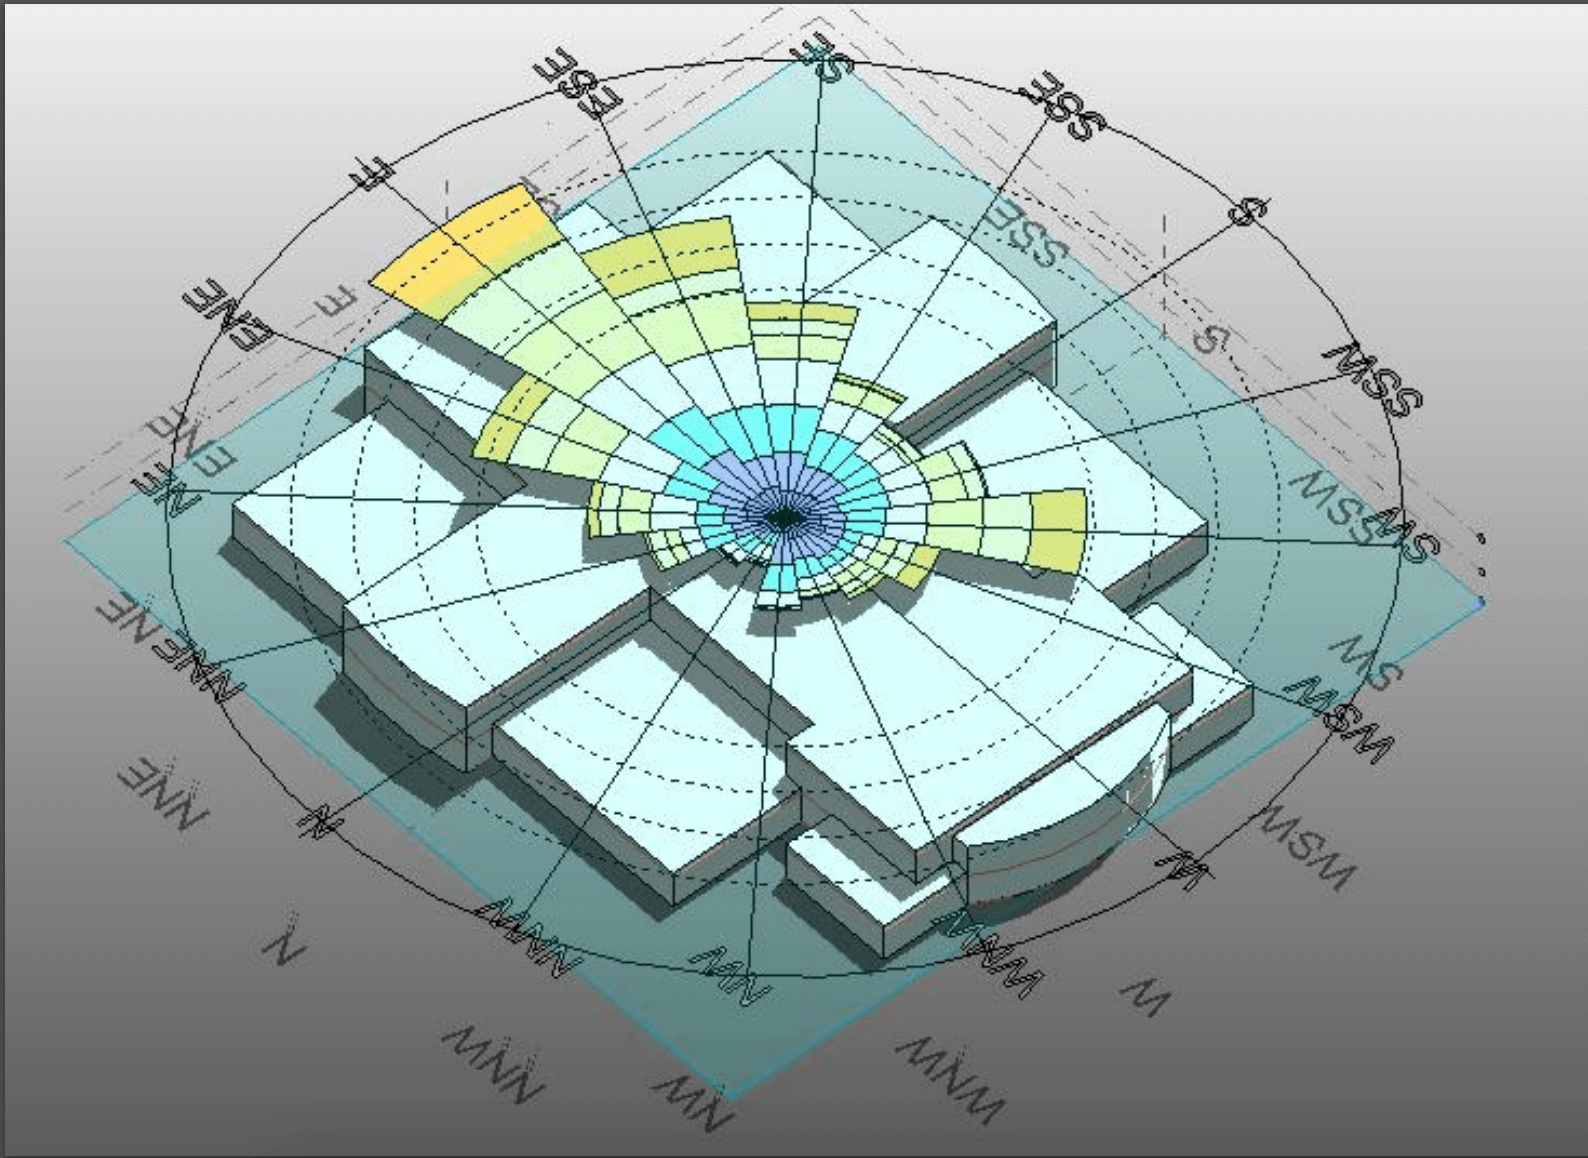
We then ran a wind tunnel simulation over the building model. This analysis serves two purposes: identifying natural airflow paths for cross-ventilation design, and locating optimal positions for turbovents or small wind turbines.
Outcome
The solar and wind data was exported into RETScreen, a clean energy analysis tool that evaluates the feasibility and cost-effectiveness of different renewable energy technologies for a given site. The software recommended specific renewable configurations based on the building's actual environmental profile.
These recommendations were presented to the BITS Pilani administration during the campus reconstruction and remodeling phase. The project demonstrated that renewable energy technologies do not require dedicated land or separate infrastructure. They can be integrated directly into the buildings where the energy is consumed, reducing carbon footprint at the source.